Investment style started to get attention in the mid-90s, and it was used to classify managers’ bias by the groups of type of strategic focus. The typical styles include “value vs. growth”, “domestic vs. international”, and “large-cap vs. small-mid cap”. Since then, new styles are discovered & defined, and classifications have increased while each of them got defined narrower.
What is investment style from the perspective of a practical application of value-oriented investment?
First, while investment style is useful as a quick summarized overview of an equity portfolio, it has a minimal significance for the managers who practice value-oriented fundamental active investment strategy.
Second, the general concept of investment style is suited sharply to passive or quantitative active investing, given its roots.
Third, there is a better way to use the investment style concept to value-oriented fundamental equity, reinforcing strategic process development & management uniquely, and this is the main focus of this article.
First, let’s revisit the backdrop of a generally-used investment style and why it does not fit with fundamental active equity.
Investment style has its original roots in portfolio risk analysis. To analyze the risk of equities, quantitative multi-factor models such as Barra became a de-facto standard risk analysis platform of an institutional equity portfolio. Each factor is associated with a specific attribute such as size (market cap) and value. It also is an explanatory variable in the regression model of total return. Some non-value factors are binary (0 or 1 for country and region), and others have score values.
In this way, each “style” has obtained two axes of risk and return. Why? Anything that has risk has to have return as its reward.
However, from the fundamental value perspective, investment risk is not equal to price volatility, i.e., what is termed generally and widely known as risk. Moreover, according to the price-oriented approach, price volatility is more or less proportional to the expected return, which by no means is consistent with the fundamental value-focused approach. It is intrinsic value – regardless of how it is measured – that determines the investment risk and investment horizon works as a secondary driver.
After all, there is a wide gap of perception between a fundamental-oriented approach and a price-oriented approach in investing. As investment style is associated with risk & return, and its definition is far apart between the two parties, the application of investment style should be designed and managed entirely differently to keep the consistency of process and philosophy.
Returning now to the general concept of investment style (of the price-oriented world of risk & return).
Computing platforms have evolved since then, and they generate more and more analysis of stocks using the newly-discovered attributes, including price volatility and price momentum. Those new attributes are combined to linked to individual portfolios, and they became the names of investment styles.
They continued to make creative efforts to invent (possible) causal inferences and new attributes, and they were given a new name of “smart beta” as an extension of investment style in the old days. This trend set up the backdrop of the development of new betas and factors these days.
True; statistically, the apparent explanation power increases as you increase the number of variables used for the regression, despite the increase in multicollinearity, which raises a question over its statistical and real validity. As a result, it looks as if most alpha as the excess return can be attributed to those new betas, as the number of them increases.
Meanwhile, new betas were very useful in developing trendy new investment products that sales & marketing managers would like to have for business development.
I wish I can write an article on smart beta sometime later on this site. Still, I would like to point out that managing a strategy to deliver “alpha” only is not the same as providing a total return that includes alpha and other inferred betas by quants.
It is too naive to assume the entire fund can get sliced and assembled easily. That may be possible in the world of price-oriented approach, but what equity investors deal with is made of value. Value Inside. The price-oriented smart xxx approach looks like just taking a quick look at the surface naively without thinking over the real essence of their actions. (Be always careful about the directions the majority is heading in the investing world. The majority rule does not work in the financial world, and it often leads to a wrong decision. Structurally, the majority rule may not be the best decision-making rule.)
On the contrary, there is an approach to decompose total return directly into the stock’s three key attributes, developed by Tony Estep and called “T-model.” This model links the equity total return directly with the fundamentals and financial variables as an identity. It is not a regression analysis, but an identical equation, which makes this approach more robust without a room for inferences. It makes the fundamental investment process consistent with value-oriented philosophy.
The three key terms in the expression are not explanatory variables.
The model is as follows:

where
T = total return
g = the growth rate of book value
PB = the ratio of price/book value at the beginning of the period.
ROE = return on equity
I associate each term on the right of this expression with a source of total return.
The first term: Growth
The second term: Shareholder Yield
The third term: Change in Valuation
This approach is not entirely accurate, but it is highly relevant and consistent. It is free from uncertainties of multivariate analysis – a lousy aspect of statistical method and data mining – and interpretation is intuitive for fundamentally focused investors.
It can be applied to a single stock. One of the applications is to use it to a group of equities such as stock index. It can then tell the characteristics of the total return of the equity market, which primarily helps managers get insights into its nature. It is quite beneficial that the model can relate each attribute as an investment style contributed precisely with total return as a simple mathematical equation.
Sun Tzu once said, “If you know the enemy and know yourself, you need not fear the result of a hundred battles.” When you use a navigation map in investing, it would be better to use a better and an original one than to use the one everyone uses.
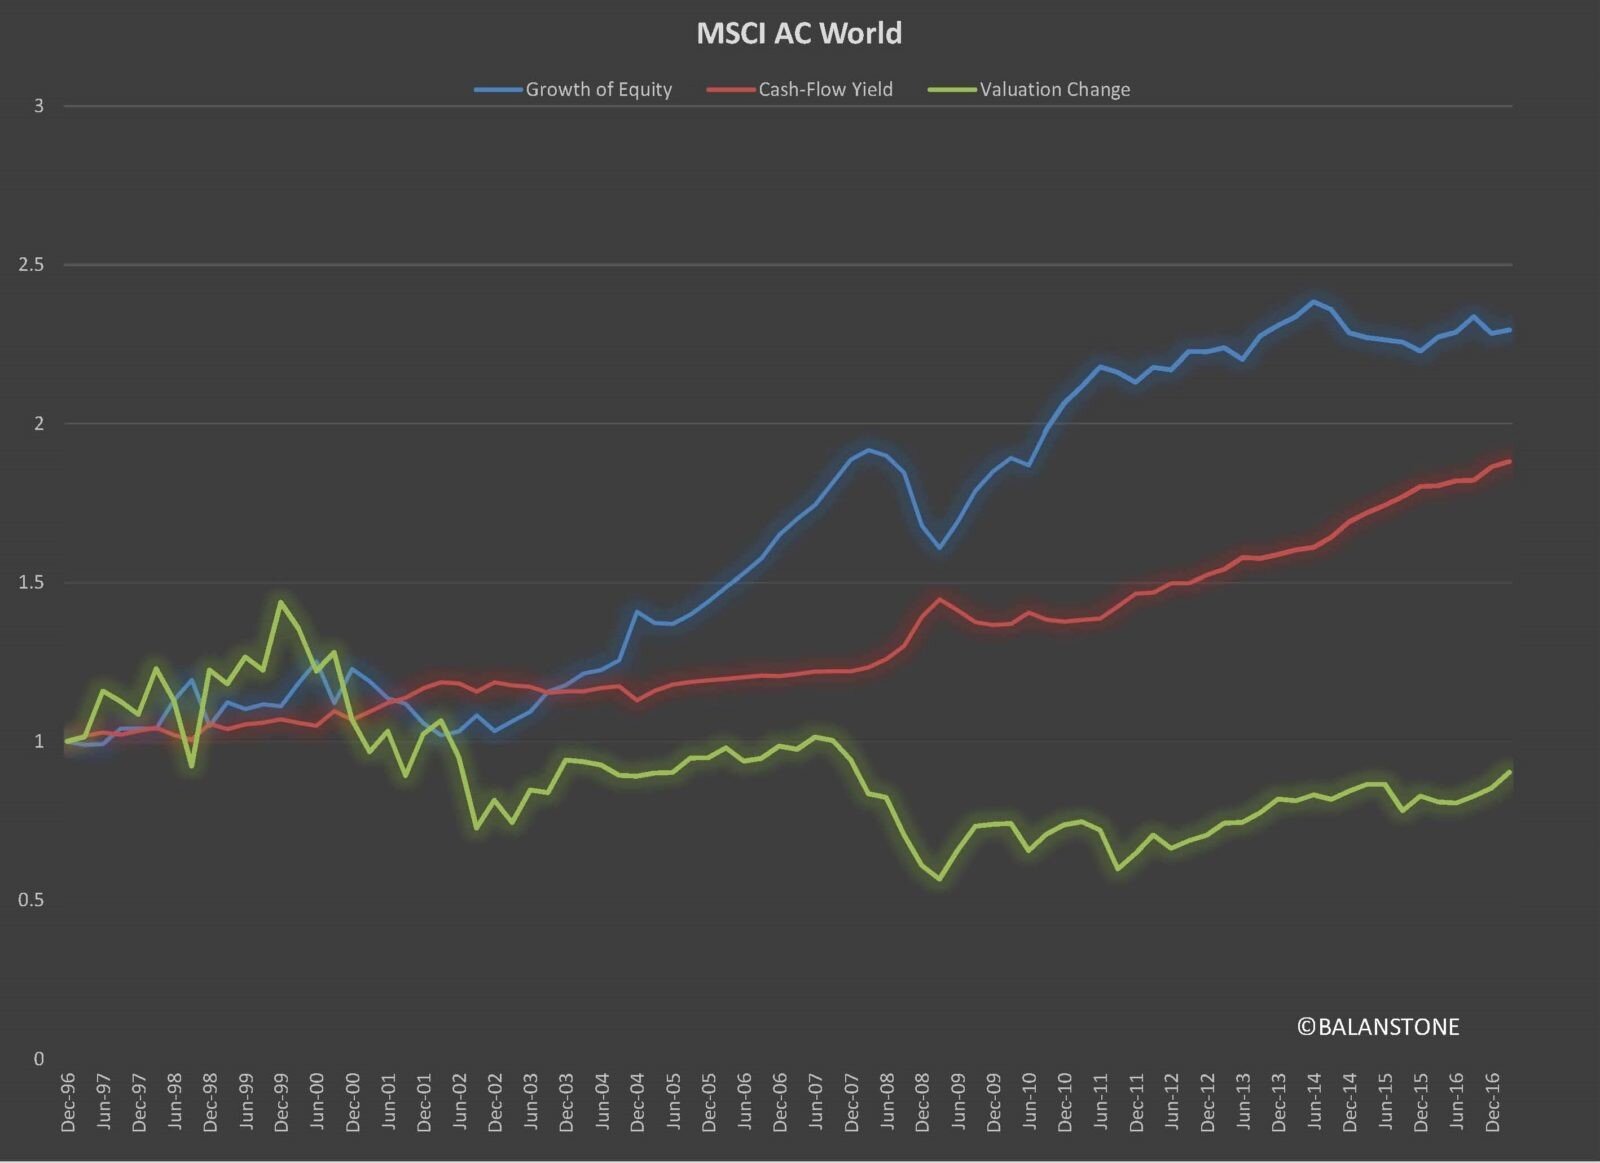
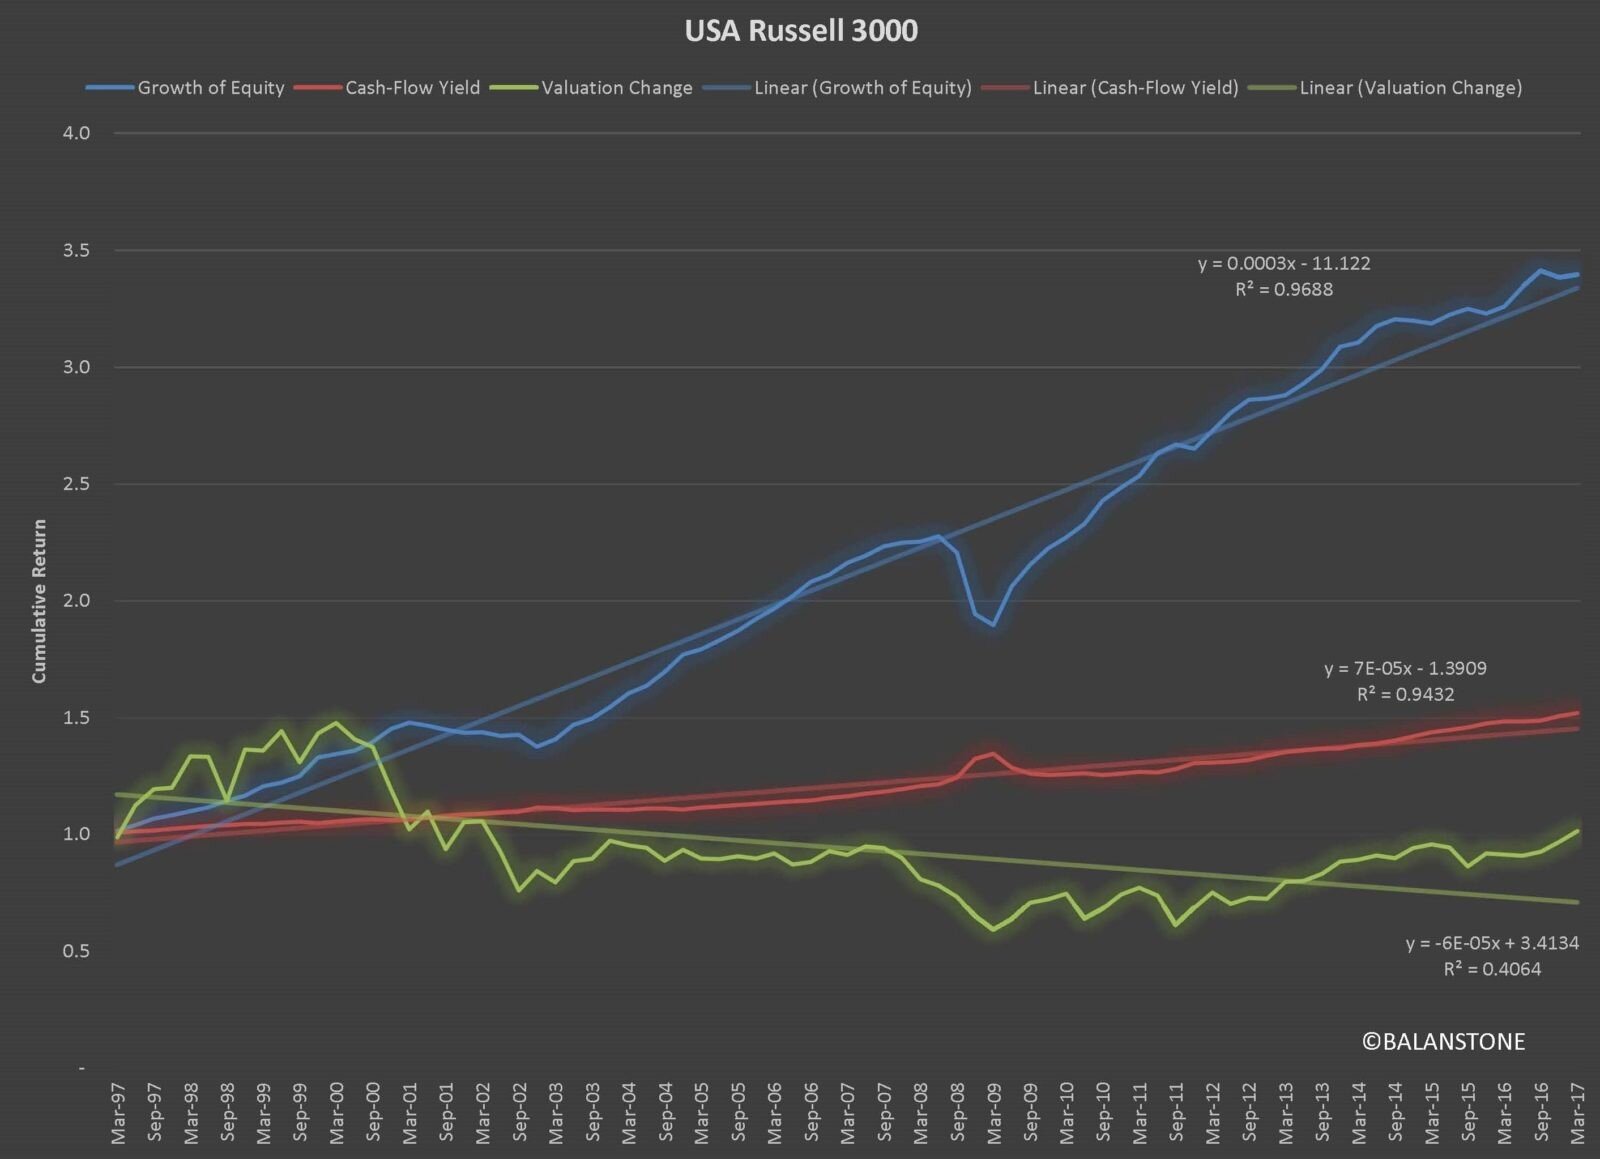
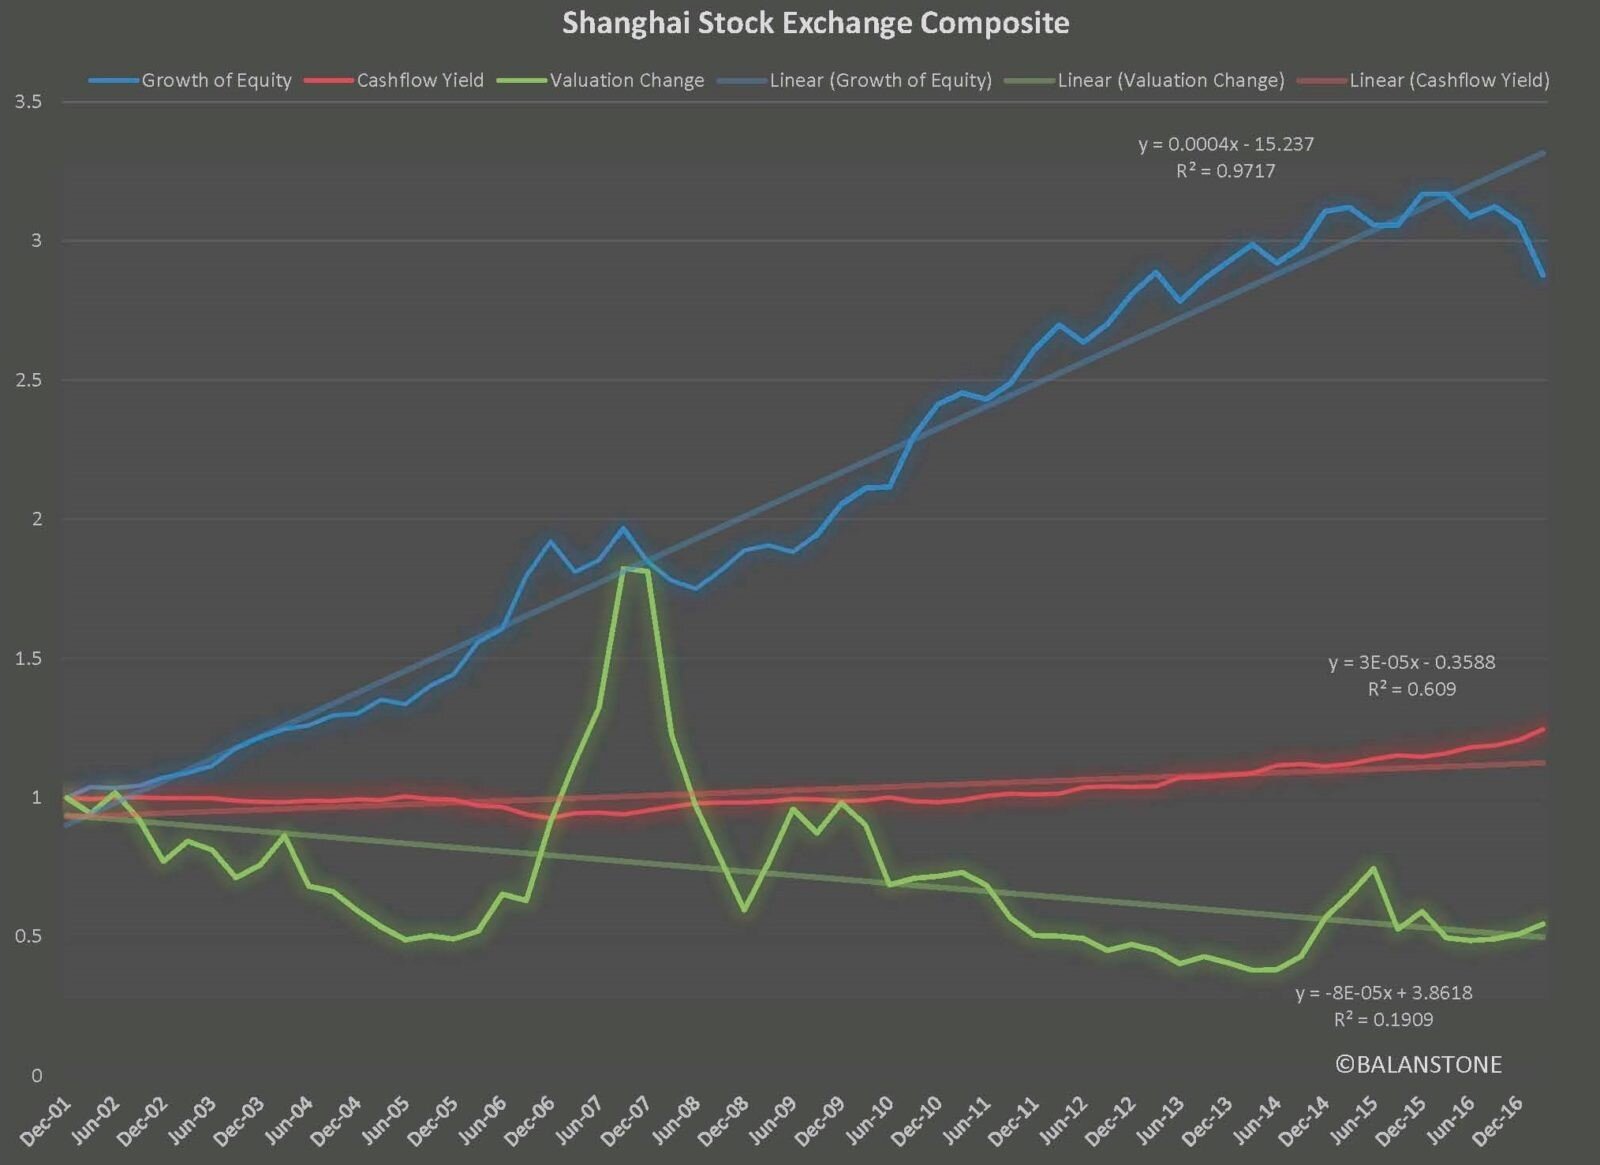
Let’s take a look at the results in charts, and below is the MSCI All Country Index, US Russell 3000, and Shanghai Stock Exchange Composite.
Interestingly and first and foremost, the charts tell you intuitively that, in aggregate, growth of equity has been the primary driver of equity total return across the markets, even in China, where the breadth of market participants is not extensive. Each market has a different mix of attributes, and each attribute has a long-term linear upward trend with occasional and relatively minor bumps.
Secondly, the variability of the total rerun in the short run is mainly caused by the valuation shifts, which in the long-run (i.e., the whole observed period of this analysis, precisely) have offset each other, resulting in neutral return. Still, the valuation shift worked as a primary driver of the total return variability for a short period. I would describe and call it as an intermittent cyclicality of total return from the valuation shift.
Shareholder yield, another element of the total return, looks like another steady factor, and the level of contribution to total return is less than the growth of equity. Its contribution to total return is more diverse than the growth of equity by geographic markets. As each geographic market has a different mix of other attributes such as sector and the size of companies, a more in-depth analysis beyond the scope of this visualized intuitive analysis is needed to discern how different they are by geographic markets.
Our question was what investment style is for genuine fundamental investors. While in general, investment risk is measured by market price movement, it is not consistent with the process that is founded truly on the principle of value-orientation. There is an approach that keeps fundamental consistency. It gives observations from the market country index that each of the three primary drivers showed a specific trend and pattern. What risk means for value-oriented investors is different from price-oriented funds. Likewise, investment style does not have the same meaning, and it needs to be developed in a strategically coherent manner. It should be a practically-applicable method with a harmonious accord.


